The Dashboard can be used to show Careplan reports/statistics.
Filtering results
Results can be filtered by date. To filter, click on the first date after “showing results from” and choose the appropriate start date on the calendar. Next, choose your end date. The date range you selected should show in purple on the calendar.
You can further filter your statistics by clicking on the filters on the right side of the page: Location, Discipline, Clinician, or Tags.
Statistics
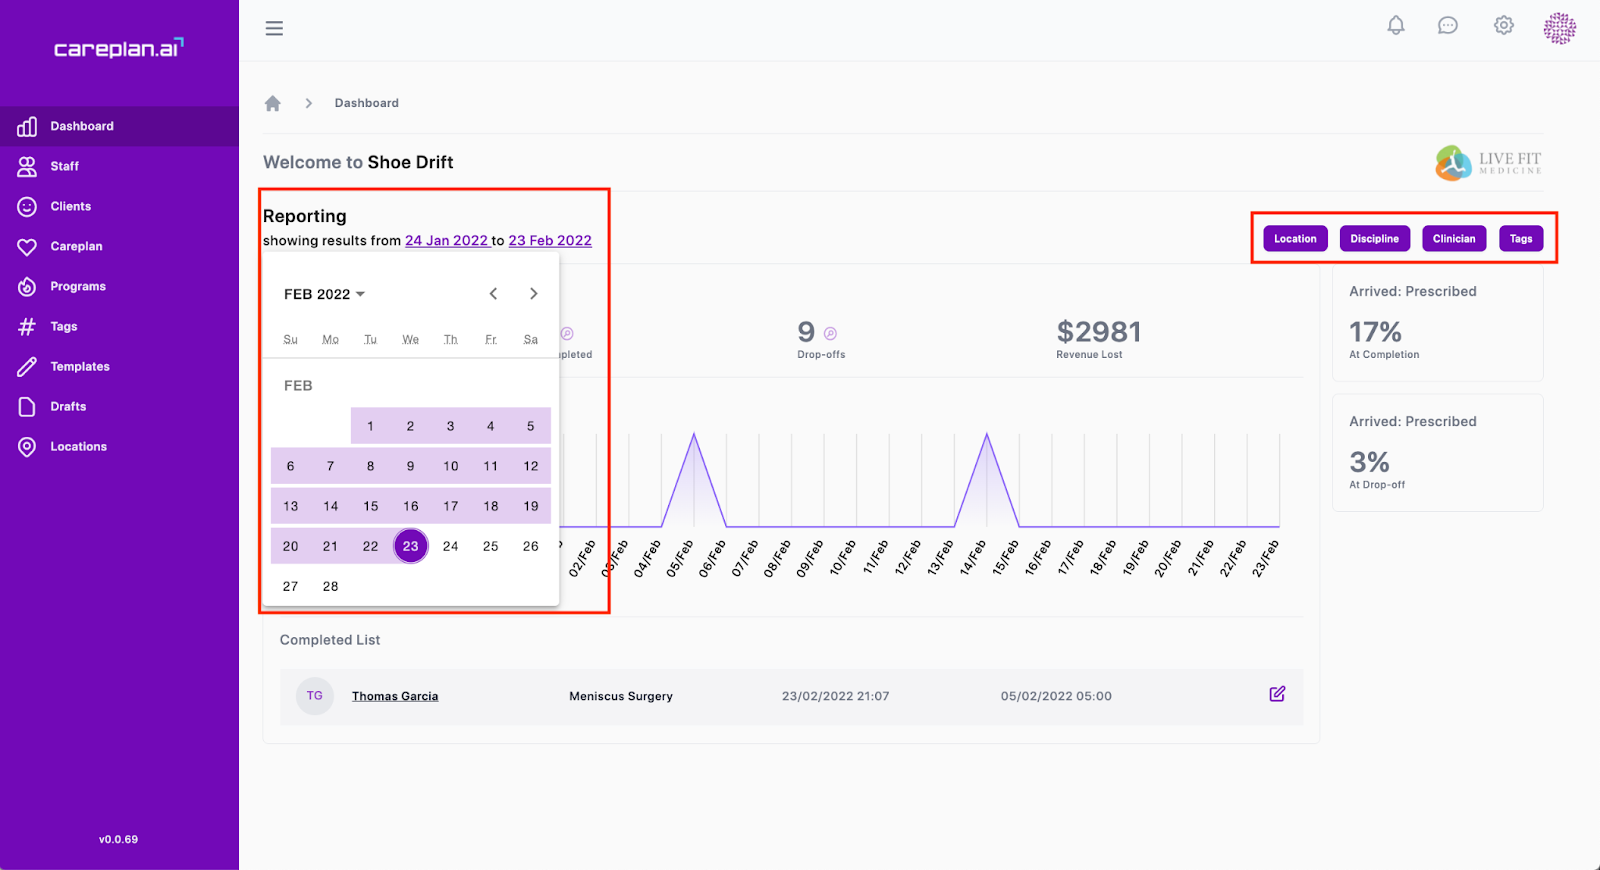
The main statistics the dashboard shows are:
- # of Careplans created
- # of Careplans completed
- # of Dropoffs
- Revenue lost
# of Careplans created
By clicking on this number, the list below will refresh to show all of the Careplans created during your selected date range. Click on a name in the list to open their profile in a separate tab.
# of Careplans completed
By clicking this number, you will see a list of all Careplans completed during your selected date range. For a Careplan to be considered completed, the Complete and Lock button must be checked when editing the Careplan.
# of Drop-offs
By clicking on this number, you will see a list of all clients who have dropped off during the selected time frame. A client is considered a drop off if they have not been active on their app, or if their Careplan or program has not been updated during this time frame.
Revenue lost
Revenue lost shows the estimated loss of revenue during the selected time frame. This is calculated based on the number of drop-offs. The remaining percentage of their Careplan (based on milestone completion) is multiplied by the average lifetime value of a client. The average lifetime value can be updated by anyone with an owner account in the settings.